
Integration flows you can draw, and still own.
Connect any two systems without turning it into a project. 2,000+ connectors, a canvas your team can actually read, and approvals, policy, and traceability built into the platform rather than sold on top.
Integration Connector: 2000+ Connectors & Visual Flows
Unify 2000+ app and data connectors with an AI-assisted visual flow builder to move data, orchestrate workflows, and automate processes.
A flow anyone in the room can follow.
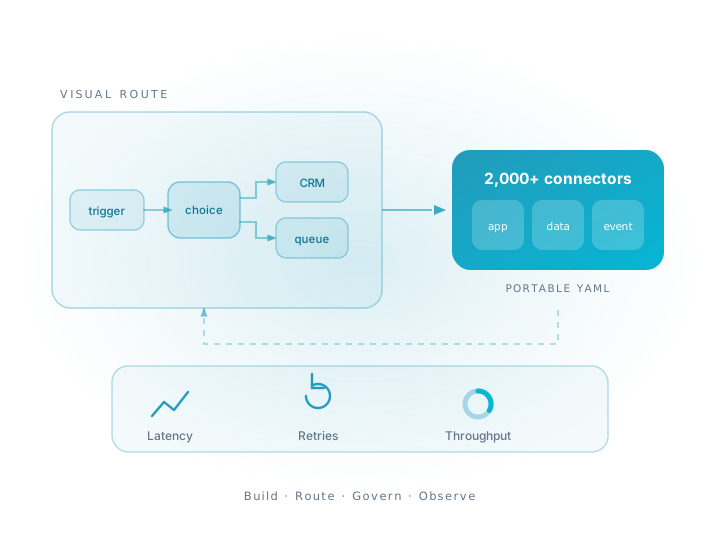
Drag a system onto the canvas and connect it to the next one. Branching, parallel delivery, retries, and rollback are steps you place on the canvas.
Today they are code that one person writes and another inherits. The palette is generated from the live connector catalogue, so a newly added system is available the day it ships.
Mistakes surface on the step that caused them rather than in a log file, and the whole flow can be test-run in a sandbox before anything reaches production.
Business analysts read the same canvas engineers build on, which is usually where the handover cost in an integration project actually sits.
If you leave us, your integrations still run.
Visual integration tools normally buy you speed at a price: the flows you build are written in a format only that vendor can run, so the work is captive from the day it is created.
Ask any integration vendor what happens to your flows if you leave. Most cannot answer it.
Ours is a straight answer. Flows are saved as Apache Camel YAML, the open standard, and the identical file runs on any Apache Camel deployment with nothing to convert.
That is the whole of the lock-in answer, and it is verifiable in an afternoon rather than taken on trust.
Everything around it is built for change: flows are versioned, move through draft, live, paused, and retired, and any earlier version can be restored.
Policy, approvals, and audit come included.
Integration platforms tend to treat policy, approvals, and audit as a premium tier. Here they are part of the platform, because an integration layer that reaches every system in the estate is exactly the thing an auditor will ask about first.
Observability works the same way. Traces are not in a separate tool: the latency of each step is drawn onto the node that produced it, alongside per-connector reliability, error inspection, and log and trace queries.
- Nothing reaches production without the approvals your policy requires, routed to the right people.
- Sensitive and personal fields are tagged where the data enters, not discovered later in an audit.
- Access is granted per system, per operation, and per environment.
- Credentials never sit inside a flow. They resolve at run time from the store you choose, including a vault in air-gapped deployments.
- Every policy decision and every credential read is written to an audit trail you can hand over.
- Retries, rate limiting, and automatic back-off on every call, so one slow system cannot take the rest down with it.
Past the API boundary.
The catalogue covers what you would expect: SaaS and CRM, cloud and storage, databases and warehouses, identity, messaging, DevOps, security, healthcare, payments, and the legacy enterprise bridge. It also keeps going where API-only tooling stops.
BACnet building management, Modbus power metering, SNMP rack PDUs, Redfish and IPMI out-of-band controllers, and GPU telemetry. Useful when the estate you are integrating includes the building and the data centre, not only the software.
Write a connector against the same contract as the first-party ones, package it as a JAR, and drop it in or upload it. Isolated class loader per plug-in, signature verification, hot reload, no fork of the platform.
Every connector is exposed as a Model Context Protocol tool, so the same governed catalogue an integration flow uses is directly available to agentic clients for tool use.
Looking for bulk movement of data rather than application integration? That is Data Ingester, which handles batch, change data capture, and advanced ETL at volume.
Works with the rest of the platform.
Move data in at any cadence: scheduled batch, on demand, or change data capture that streams every insert and update as it happens.
Read moreBuild transformation pipelines on a visual canvas or in a notebook, whichever suits the person doing the work. One engine for batch, streaming, and on demand.
Read moreTake a model from data preparation to production in one place. AutoML and experiment tracking, one-click deployment as a versioned API, drift monitoring after go-live.
Read moreBring the integration nobody wants to own.
We will build the route on the canvas, run it in the sandbox, and show you the YAML it produces.