
40 copilots, not one chat box.
A general assistant pointed at a data platform gives you confident answers about tables that do not exist. Every copilot here is scoped to one part of the platform, reads live metadata rather than a trained snapshot, and answers inside the permission model of the person asking.
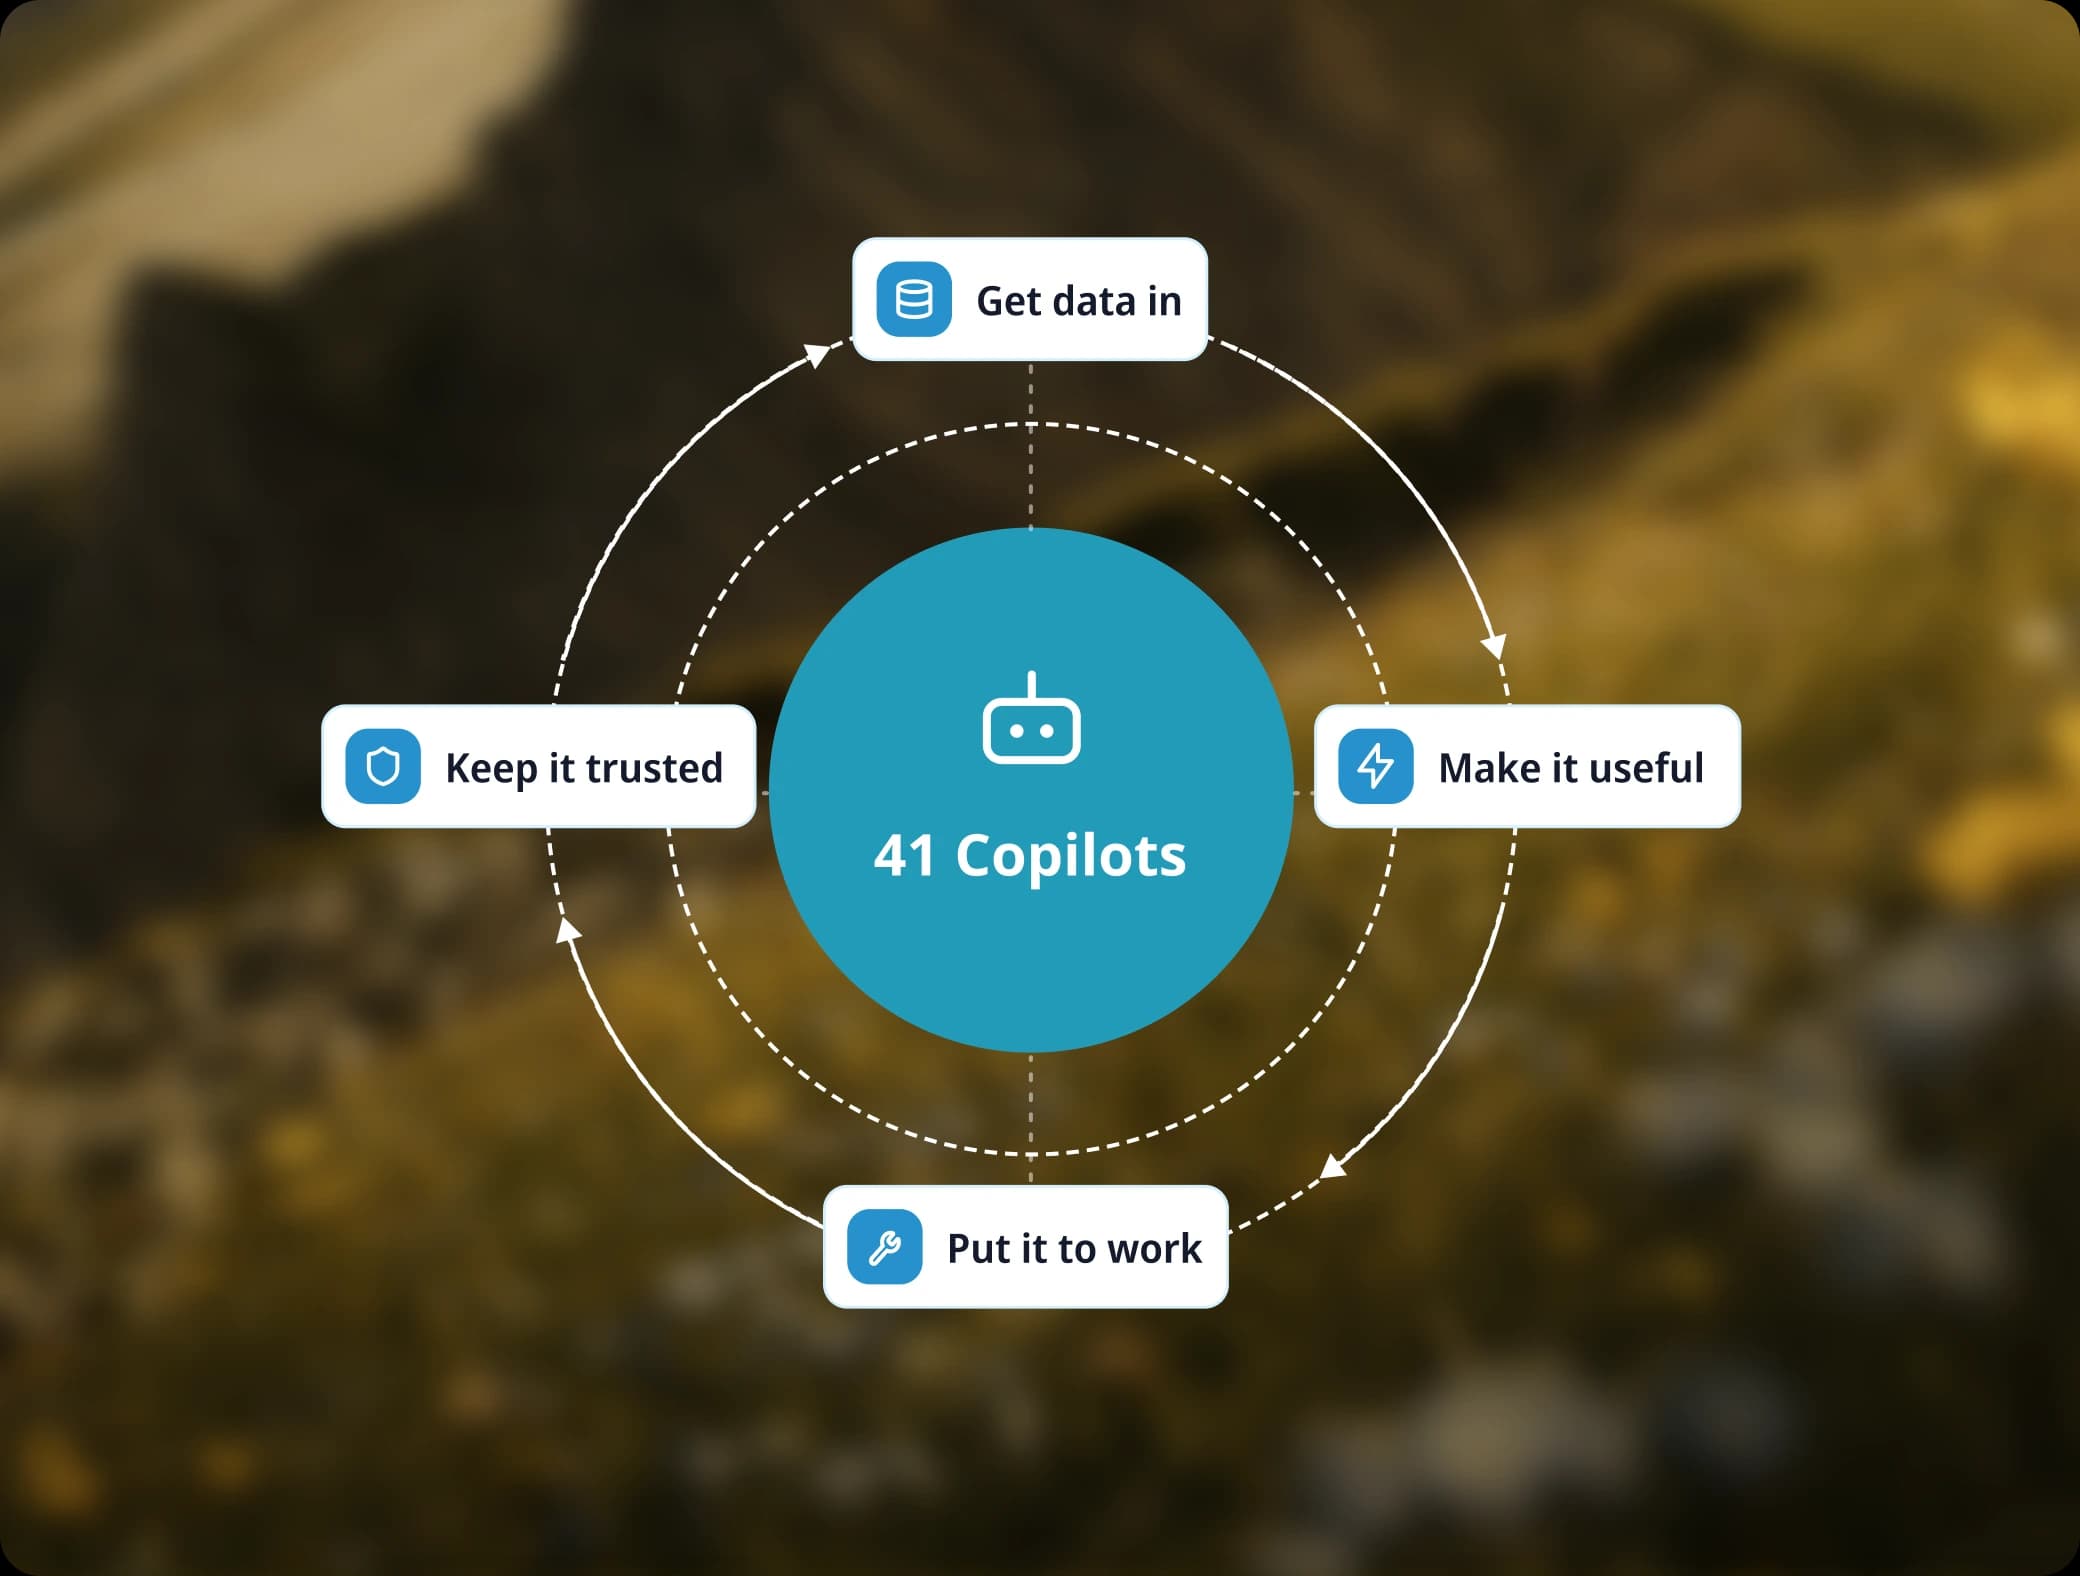
Grouped the way the platform is.
The copilots divide across the same four stages as the product itself, with nothing left over. Keeping data trusted and getting it in carry the most, because that is where most of the work still goes.
Get data in
12- Ingester 360
- X → Y Journey Builder
- Flow Summarizer
- ETL Orchestrator
- CDC Sync Builder
- Pipeline Builder
- Notebook Builder
- Connector Advisor
- Integration Flow Builder
- Integration 360
- Integration Ops
- Governance Assistant
Make it useful
6- Deployment Planner
- Operations Hub
- Infrastructure
- CDC Executions
- Advanced ETL Executions
- Transformer 360
Put it to work
9- SMART Insights
- Optimization Recommendation
- Package Ops
- Execution Summarizer
- Recommendation Assistant
- Talk-to-Data
- API Builder
- API Ops
- MCP Orchestrator
Keep it trusted
13- Discovery
- Auto Documentation
- Classification & Sensitivity
- Ontology
- Data Profiling
- Lineage
- Data Quality
- Observability & Incident
- Certification
- Schema Change Impact
- Policy Enforcement
- Compliance & Governance
- Source Onboarding
Get data in
Build, run and explain the pipelines and connections that move data onto the platform.
Ingester 360
Searches and explains every ingestion deployment, package and execution in one place.
X → Y Journey Builder
Builds a direct source to destination flow, including connections and column mapping.
Flow Summarizer
Explains what any ingestion flow does, what it ran, and how it went.
ETL Orchestrator
Coordinates ETL flows from build to run, keeping each step in order and in view.
CDC Sync Builder
Sets up change data capture in log, query or trigger mode, with a preview before you commit.
Pipeline Builder
Walks you through building an ingestion pipeline, one decision at a time.
Notebook Builder
Describe the ingestion workflow you want and it writes the notebook: ingest, transform, validate, load.
Connector Advisor
Finds the right connector, explains its operations, and lets you test it in the same conversation.
Integration Flow Builder
Designs, validates and tests an integration route as a draft before anything goes live.
Integration 360
Opens up projects, integrations, executions, secrets and connectivity in one view.
Integration Ops
Tracks connector health, traces, logs and live connectivity across your estate.
Governance Assistant
Reports connector security posture, approvals, policies, classification and open incidents.
Make it useful
Plan deployments, then see how every transformation, execution and cluster is behaving.
Deployment Planner
Plans an ingestion deployment and validates the schedule and resources before it lands.
Operations Hub
One assistant for Spark monitoring, troubleshooting and tuning, whatever your experience level.
Infrastructure
Reports live cluster capacity: core allocation, memory pressure and pod demand.
CDC Executions
Answers questions on change data capture runs: status, lag, failures and what they touched.
Advanced ETL Executions
Answers questions on advanced ETL runs: status, resources, SLA, rule checks, traceability.
Transformer 360
Finds transformation deployments and reports their health, performance and cost.
Put it to work
Query, publish and tune. Ask in plain English, ship an API, act on the recommendations.
SMART Insights
One assistant for ingestion monitoring, troubleshooting, scheduling and configuration.
Optimization Recommendation
Recommends throughput, resource, scheduling and connector changes for pipelines you already run.
Package Ops
Monitors package runs, investigates failures and reads performance trends in plain English.
Execution Summarizer
Turns an execution into an answer: what ran, what failed, what was slow, what it cost.
Recommendation Assistant
Quantifies savings by category and names the over-allocated and under-allocated workloads.
Talk-to-Data
Writes executable SQL from a plain-English question using live metadata, never guessed names.
API Builder
Turns a query into a published, parameter-validated API resource step by step.
API Ops
Shows API pools, resources and clients, with usage, performance and access patterns.
MCP Orchestrator
Lists registered MCP servers, their tools and their health, and answers questions on them.
Keep it trusted
Profile, classify, certify and trace every asset, and see what a schema change will break.
Discovery
Finds the data assets you hold across connected sources and brings them into the catalogue.
Auto Documentation
Drafts descriptions for tables and columns from live metadata, ready for an owner to review.
Classification & Sensitivity
Finds personal and financial data, tags it, and propagates the label down the lineage tree.
Ontology
Maps schemas and columns to business terms, resolves synonyms and proposes taxonomies.
Data Profiling
Builds a statistical fingerprint of every table and column, with masked previews.
Lineage
Traces a field back to its source at column level and explains the derivation in plain English.
Data Quality
Recommends assertion rules from profiling history and rolls results into a quality score.
Observability & Incident
Watches freshness, latency and health, then raises an incident to the named data owner.
Certification
Grants and revokes trust badges against documentation, quality and ownership checks.
Schema Change Impact
Names every report, pipeline and dashboard a schema change will break, before it breaks.
Policy Enforcement
Checks data access and use against the policies you have set, and flags what breaks them.
Compliance & Governance
Reports where your data estate stands against its governance and compliance controls.
Source Onboarding
Verifies a new source, inspects its schema, and hands it to profiling and classification.
The conversational surfaces underneath them.
The copilots are scoped agents. These are the general capabilities they are built on, available across the platform rather than tied to one module.
Talk to Your Data
Plain-English queries over SQL, NoSQL, S3, Cassandra, and APIs.
ETL/ELT Designer
Describe the requirement, and the agent ships a deployment-ready pipeline.
Spark Summarizer
Turns verbose Spark logs into "what ran, failed, was slow, fix this."
ProcBot Designer
Describe a process, and the agent generates the working script in bash, Python, Terraform, or Ansible.
Sherlock
Autonomous agents help with not only problem discovery but throughout the process from problem detection to auto-remediation and closure.
DataOps AI
Ask about pipeline health and SLAs; answers come from live telemetry.
AI Governance & Intelligence
AI agents continuously enrich metadata, classify sensitive data, monitor compliance, and generate governance insights across enterprise data assets.
Data Exploration AI
Describe the requirements in natural language, and the agent generates the transformation code behind the scenes to produce the output.
Every copilot above was built in a studio you also get.
The catalogue on this page is not a fixed set that ships and stops. It is what our own teams built with the tooling that comes with the platform, and the same tooling is how you add the ones we did not think of.
Waits to be asked
Answers a person in their own words, over certified data, with the source of every statement attached. Built for the people who have questions and no appetite for SQL.
Acts on a schedule or a signal, inside your rules
Runs on a trigger or a schedule, decides what to do inside the boundaries you set, and stops for a person where you told it to. Built for the work nobody wants to own.
An agent you build starts governed.
It reads the same ontology, resolves names through the same catalogue, and answers inside the same permission model as everything else on the platform. Governance is not a layer you add to it afterwards, because there is nowhere else for it to run.
Then you have to watch them.
An agent that answers a question is a pipeline that nobody scheduled. It has runs, failures, cost and drift, and it needs the same operational treatment as anything else that touches production.
Telemetry, the same as any pipeline
Runs, failures, latency and cost across models, agents, prompts and executions, in the same operations view as your ingestion and transformation workloads.
Prompts go through release management
A prompt is tested and certified before it reaches production, and released as a version you can point at later. Changing one is a release, not an edit.
Three things that are true of every one of them.
Runs on your permission model
A copilot sees what the person asking is allowed to see. Row and column level rules apply to the answer the same way they apply to a query.
Live metadata, read at query time
Names of sources, tables and columns are fetched at the time of the question. A copilot that cannot find a column says so and asks.
On your infrastructure
The copilots run on self-hosted models inside your deployment, including air-gapped ones. No prompt and no result is sent to a model vendor.

Ask one of them something about your own stack.
Thirty minutes, your connectors, your tables. The copilots answer on live metadata, so you will see straight away whether they are useful.