
The numbers your business runs on, in one place everyone trusts
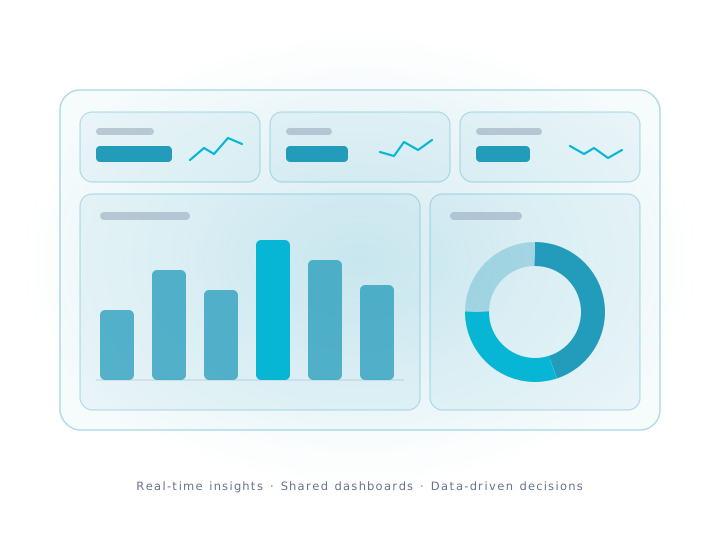
Real-time data access and insights
Access transformed data in real-time with efficient data pipelines and create interactive dashboards and reports with real-time analytics and visualization tools. Advanced query and reporting tools enable quick and precise data retrieval for gaining deep insights and making data-driven decisions with confidence.
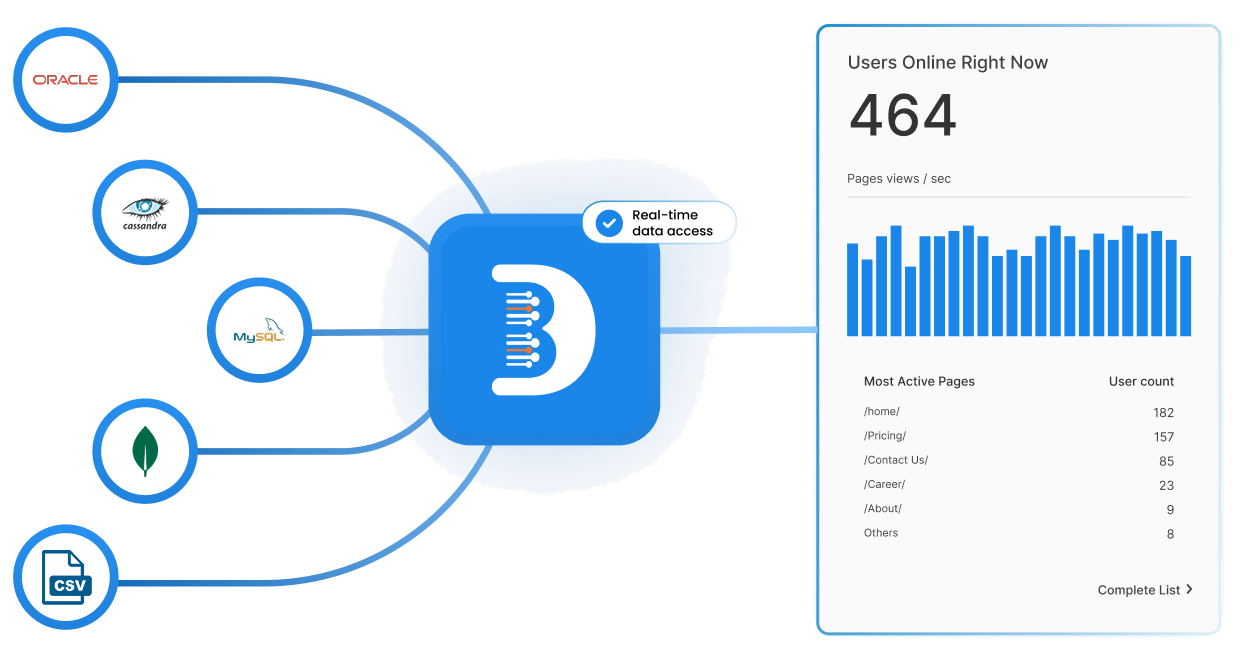
Business Intelligence: Real-Time Dashboards & Reporting
Turn enterprise data into interactive dashboards, KPI monitoring, and automated reports so teams make faster, data-driven decisions.
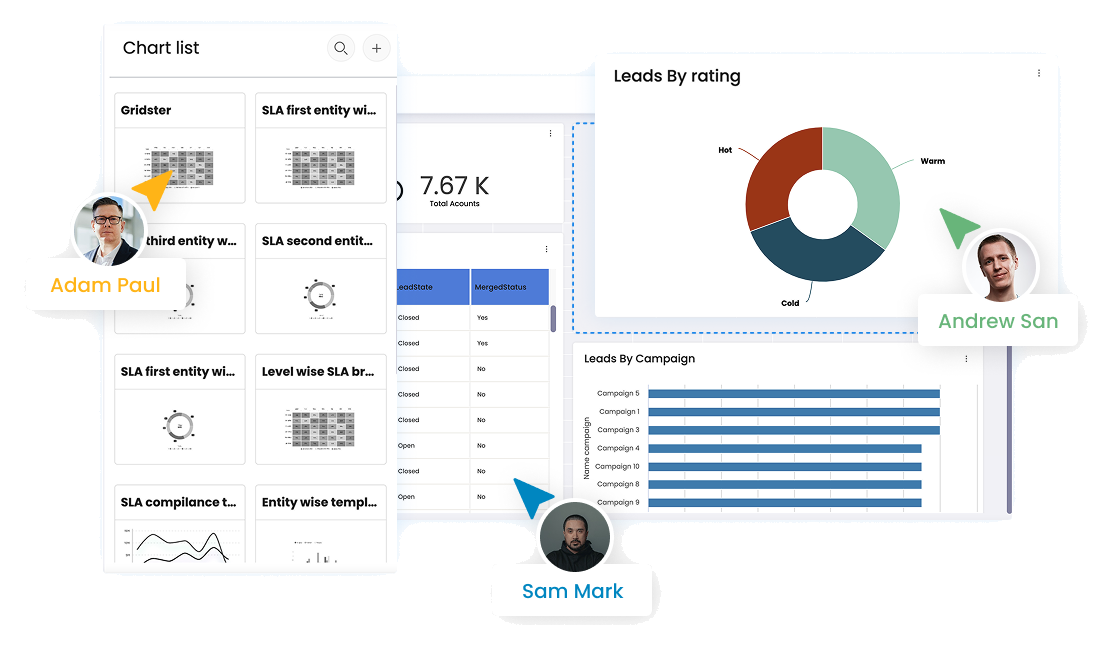
Sharing without exporting
Dashboards are built around the indicators a given team actually watches, not a default template. Sharing one takes a permission rather than an export, which means the people arguing about a number are at least looking at the same number.
Redefined efficiency
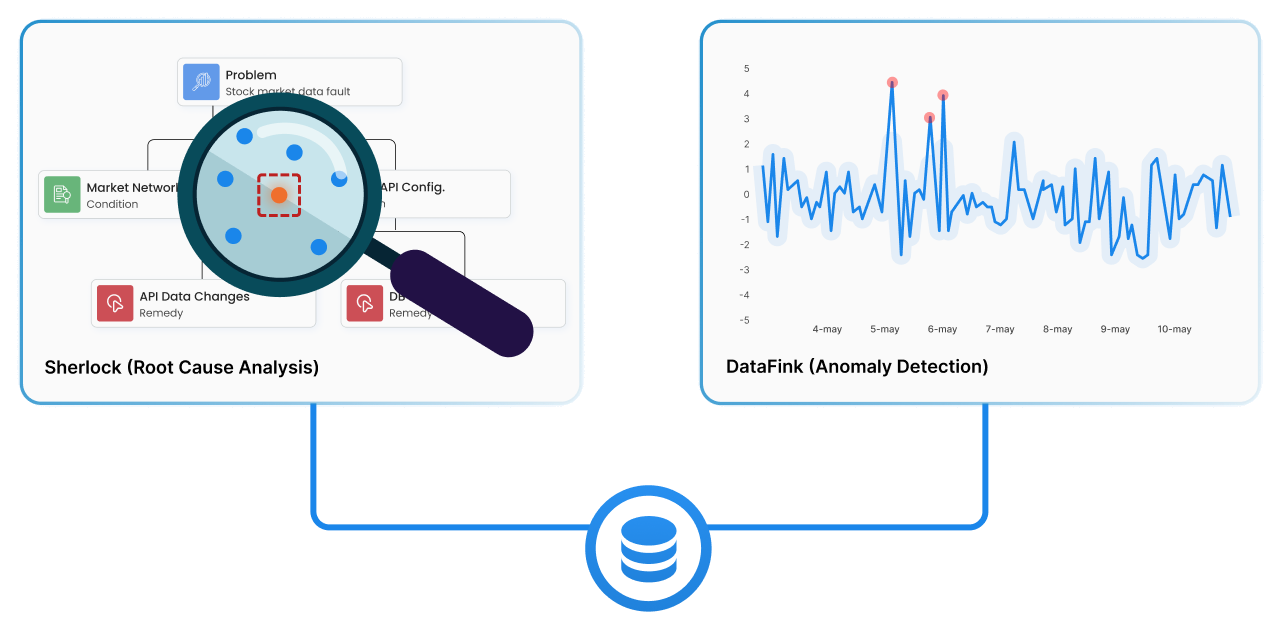
Pull “Anomaly Detector” into a report to flag outliers in the operation, and “Sherlock” to trace what caused them. “Data Insider” gives one query interface across sources, so a single report can draw on several systems without a separate integration for each.
Works with the rest of the platform.
Turn any SQL or NoSQL source into a secured REST API. Row and column-level security, rate limiting, versioning, and generated documentation are included.
Read moreMove data in at any cadence: scheduled batch, on demand, or change data capture that streams every insert and update as it happens.
Read moreConnect any two systems without a custom project. Build the flow on a visual canvas, test it before it goes live, and run it with approvals attached.
Read morePut your data in front of the people who decide
See Analytics build dashboards on your own pipelines and share them across your stakeholders, live, on your stack.