From data to wisdom, data-driven decisions simplified
Leverage advanced analytics capabilities, create custom dashboards and dynamic reports from a rich array of visualization tools. Gain a competitive edge by basing the decisions on real-time data, allowing businesses to respond to changing conditions swiftly.
Actionable insights
Make data-driven decisions confidently with timely and relevant insights.
Customization
Tailor dashboards and reports to match specific business goals.
Collaboration
Share reports and dashboards seamlessly with teams within enterprise.
Real-time advantage
Ensure analysis and decision making are always based on latest information.
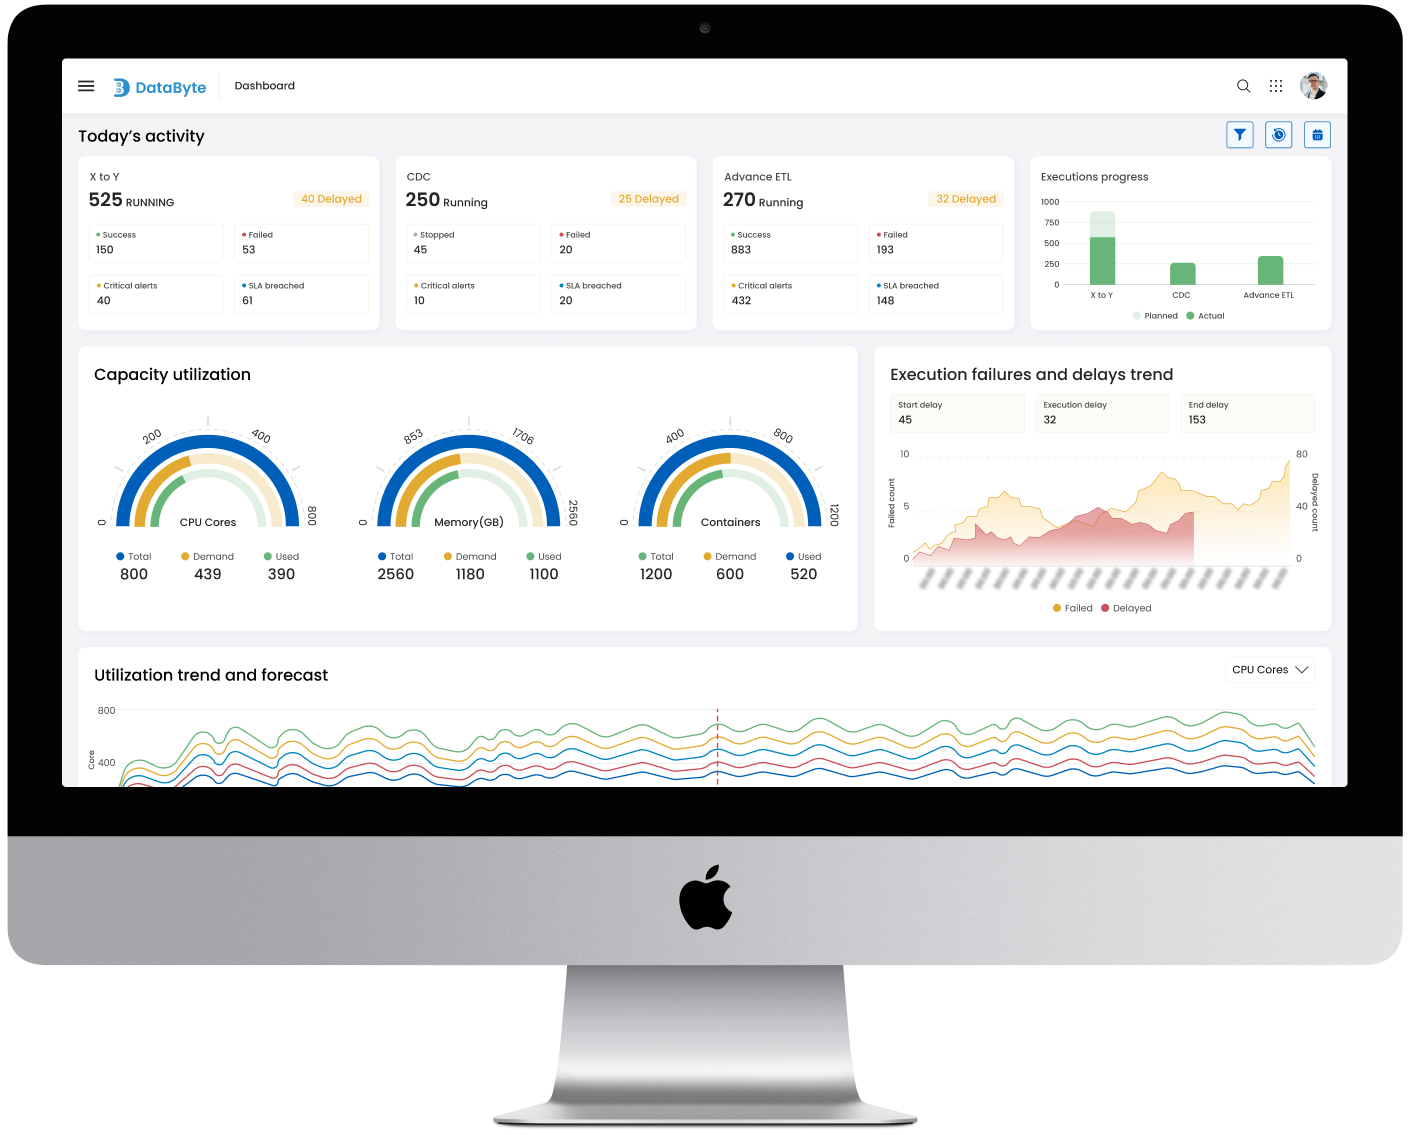
Craft the data story with custom dashboards & dynamic reports
DataByte's Business Intelligence takes customization to the next level with its custom dashboards and dynamic reporting feature.
It empowers businesses to design, shape, and tailor dashboards to precisely match unique needs and objectives. It also facilitates in generating real-time reports effortlessly.
These reports are more than just static snapshots; they adapt and evolve as data changes, ensuring that teams are always working with the most up-to-date information.
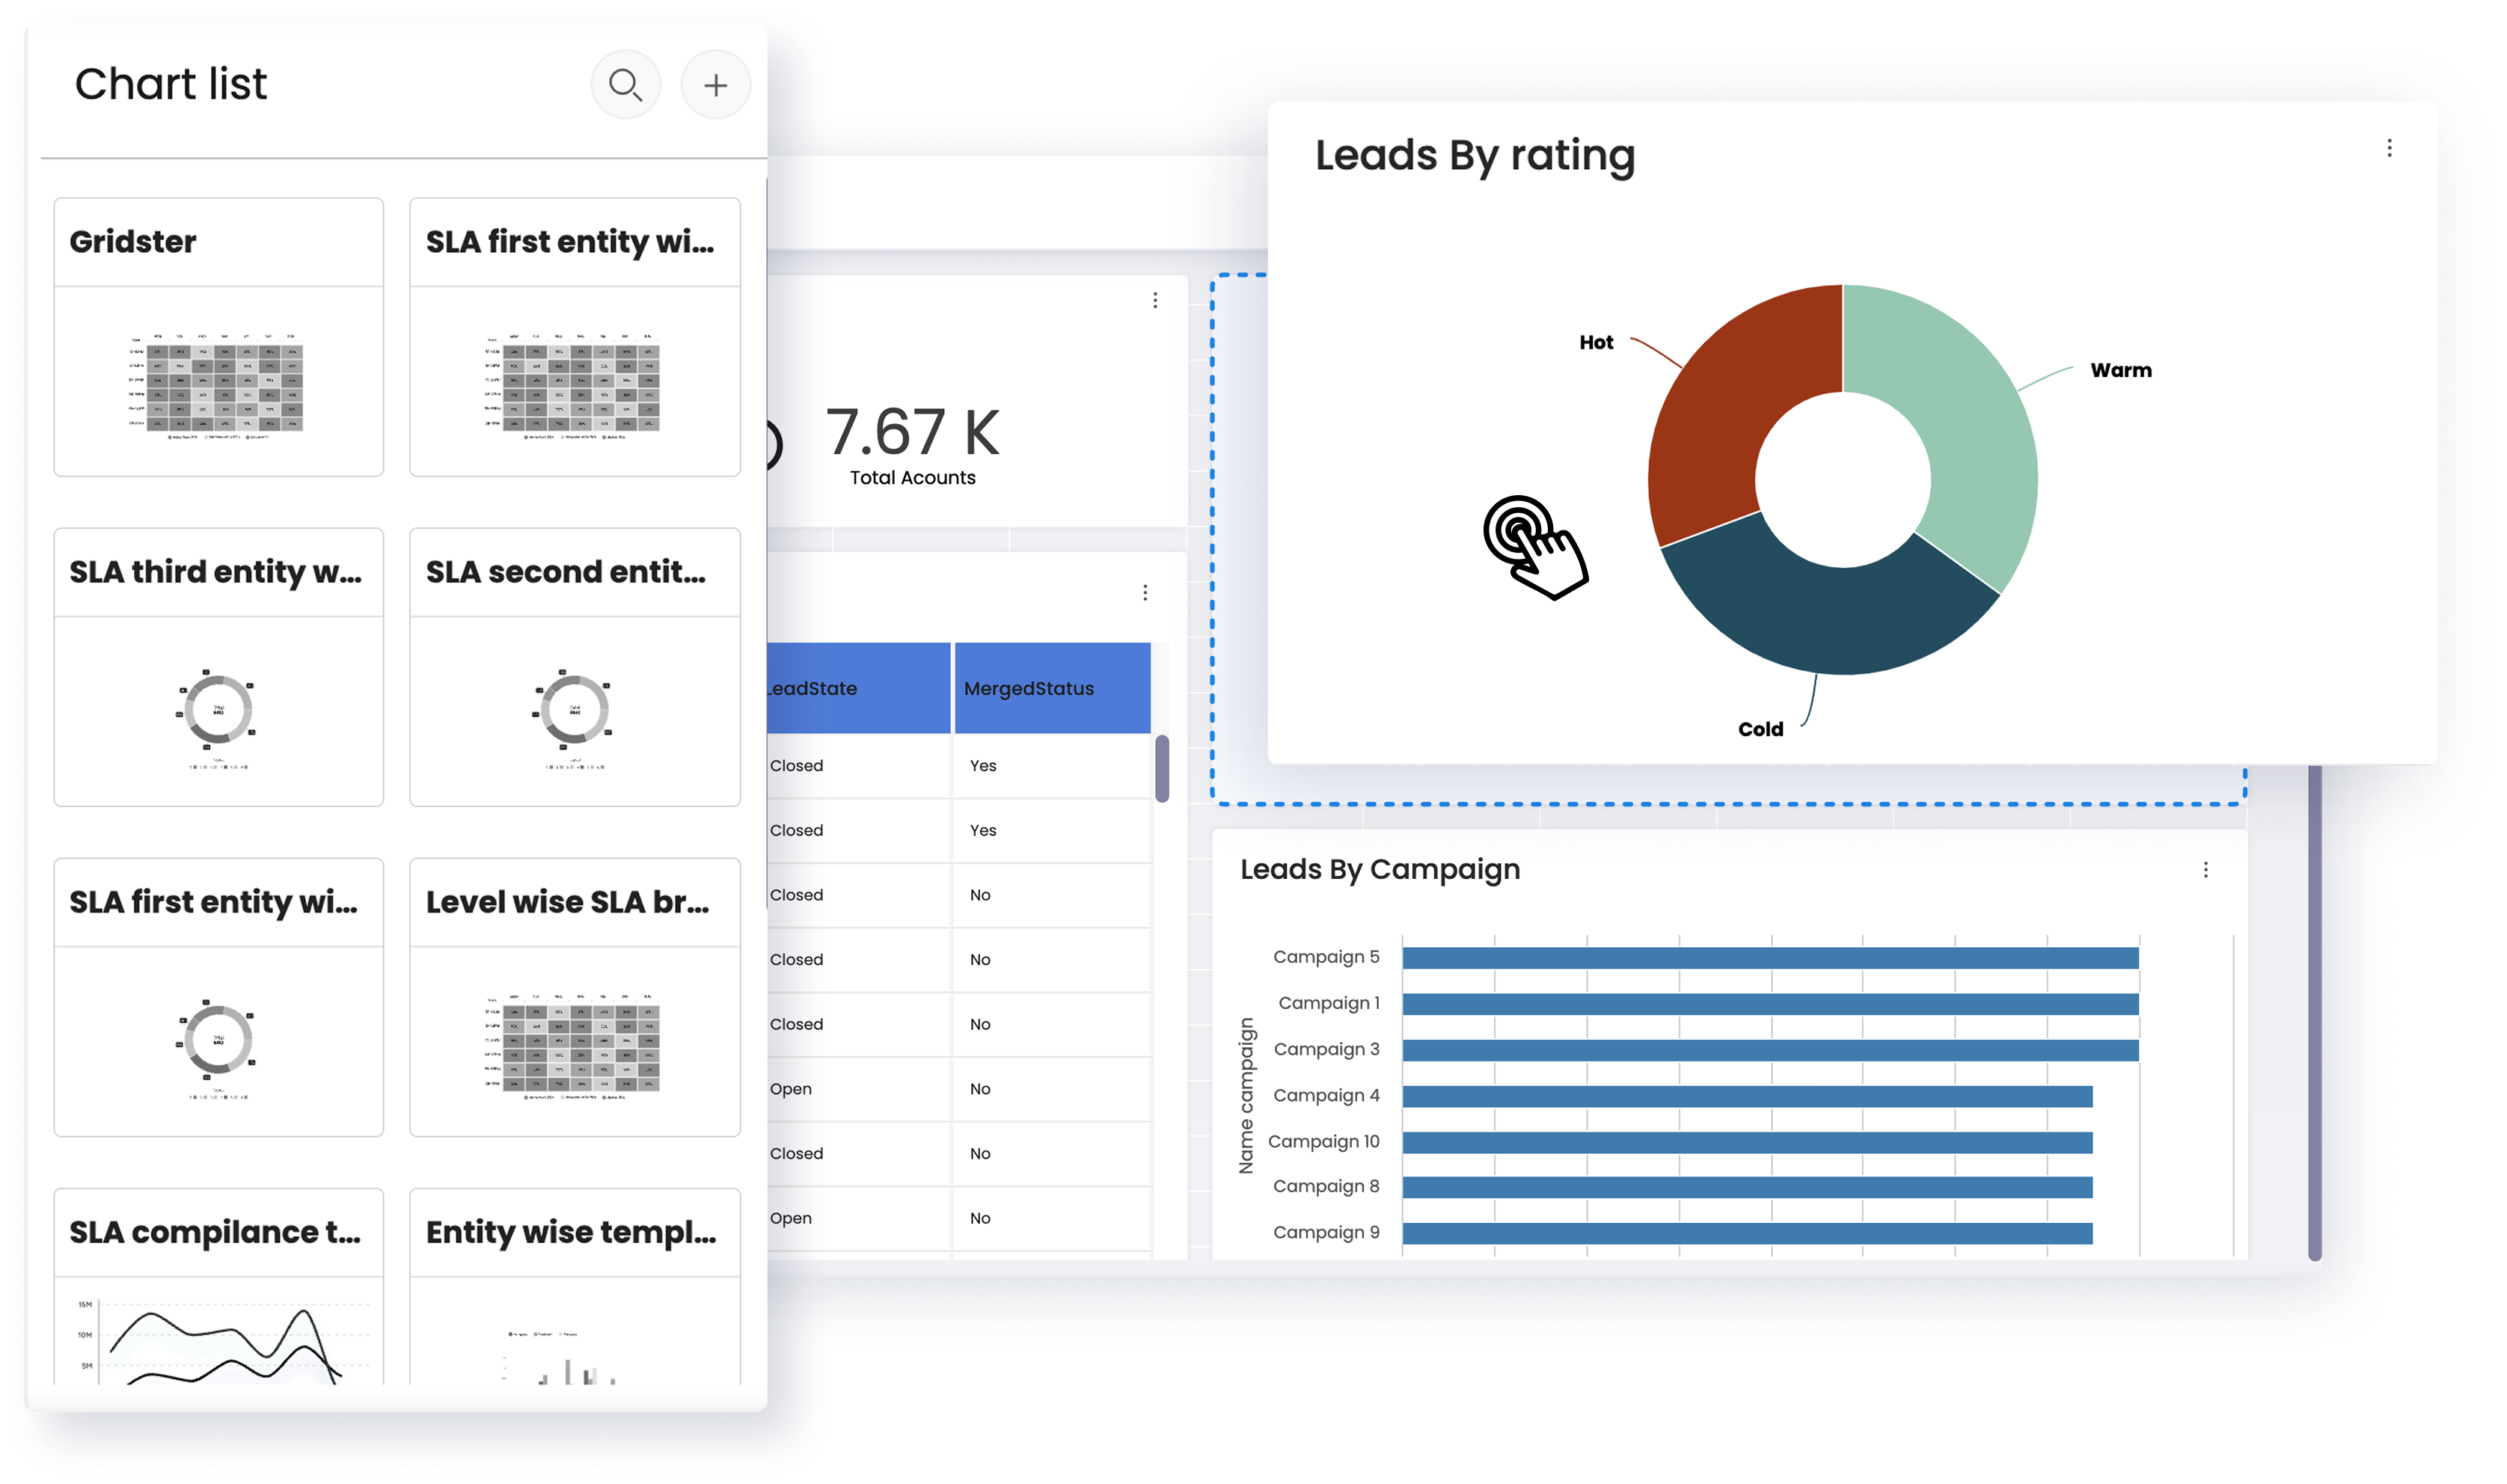
Transform data into impactful insights with diverse visualizations
The way data is visualized can make all the difference in understanding its intricacies and making informed decisions.
DataByte's Business Intelligence offers an extensive array of visualization tools that empower users to explore, analyze, and communicate their data insights in compelling and meaningful ways.
Choose from a rich variety of widgets and visualization tools to populate the dashboard. From interactive charts and graphs to dynamic heatmaps, select the widgets that best convey required data story.
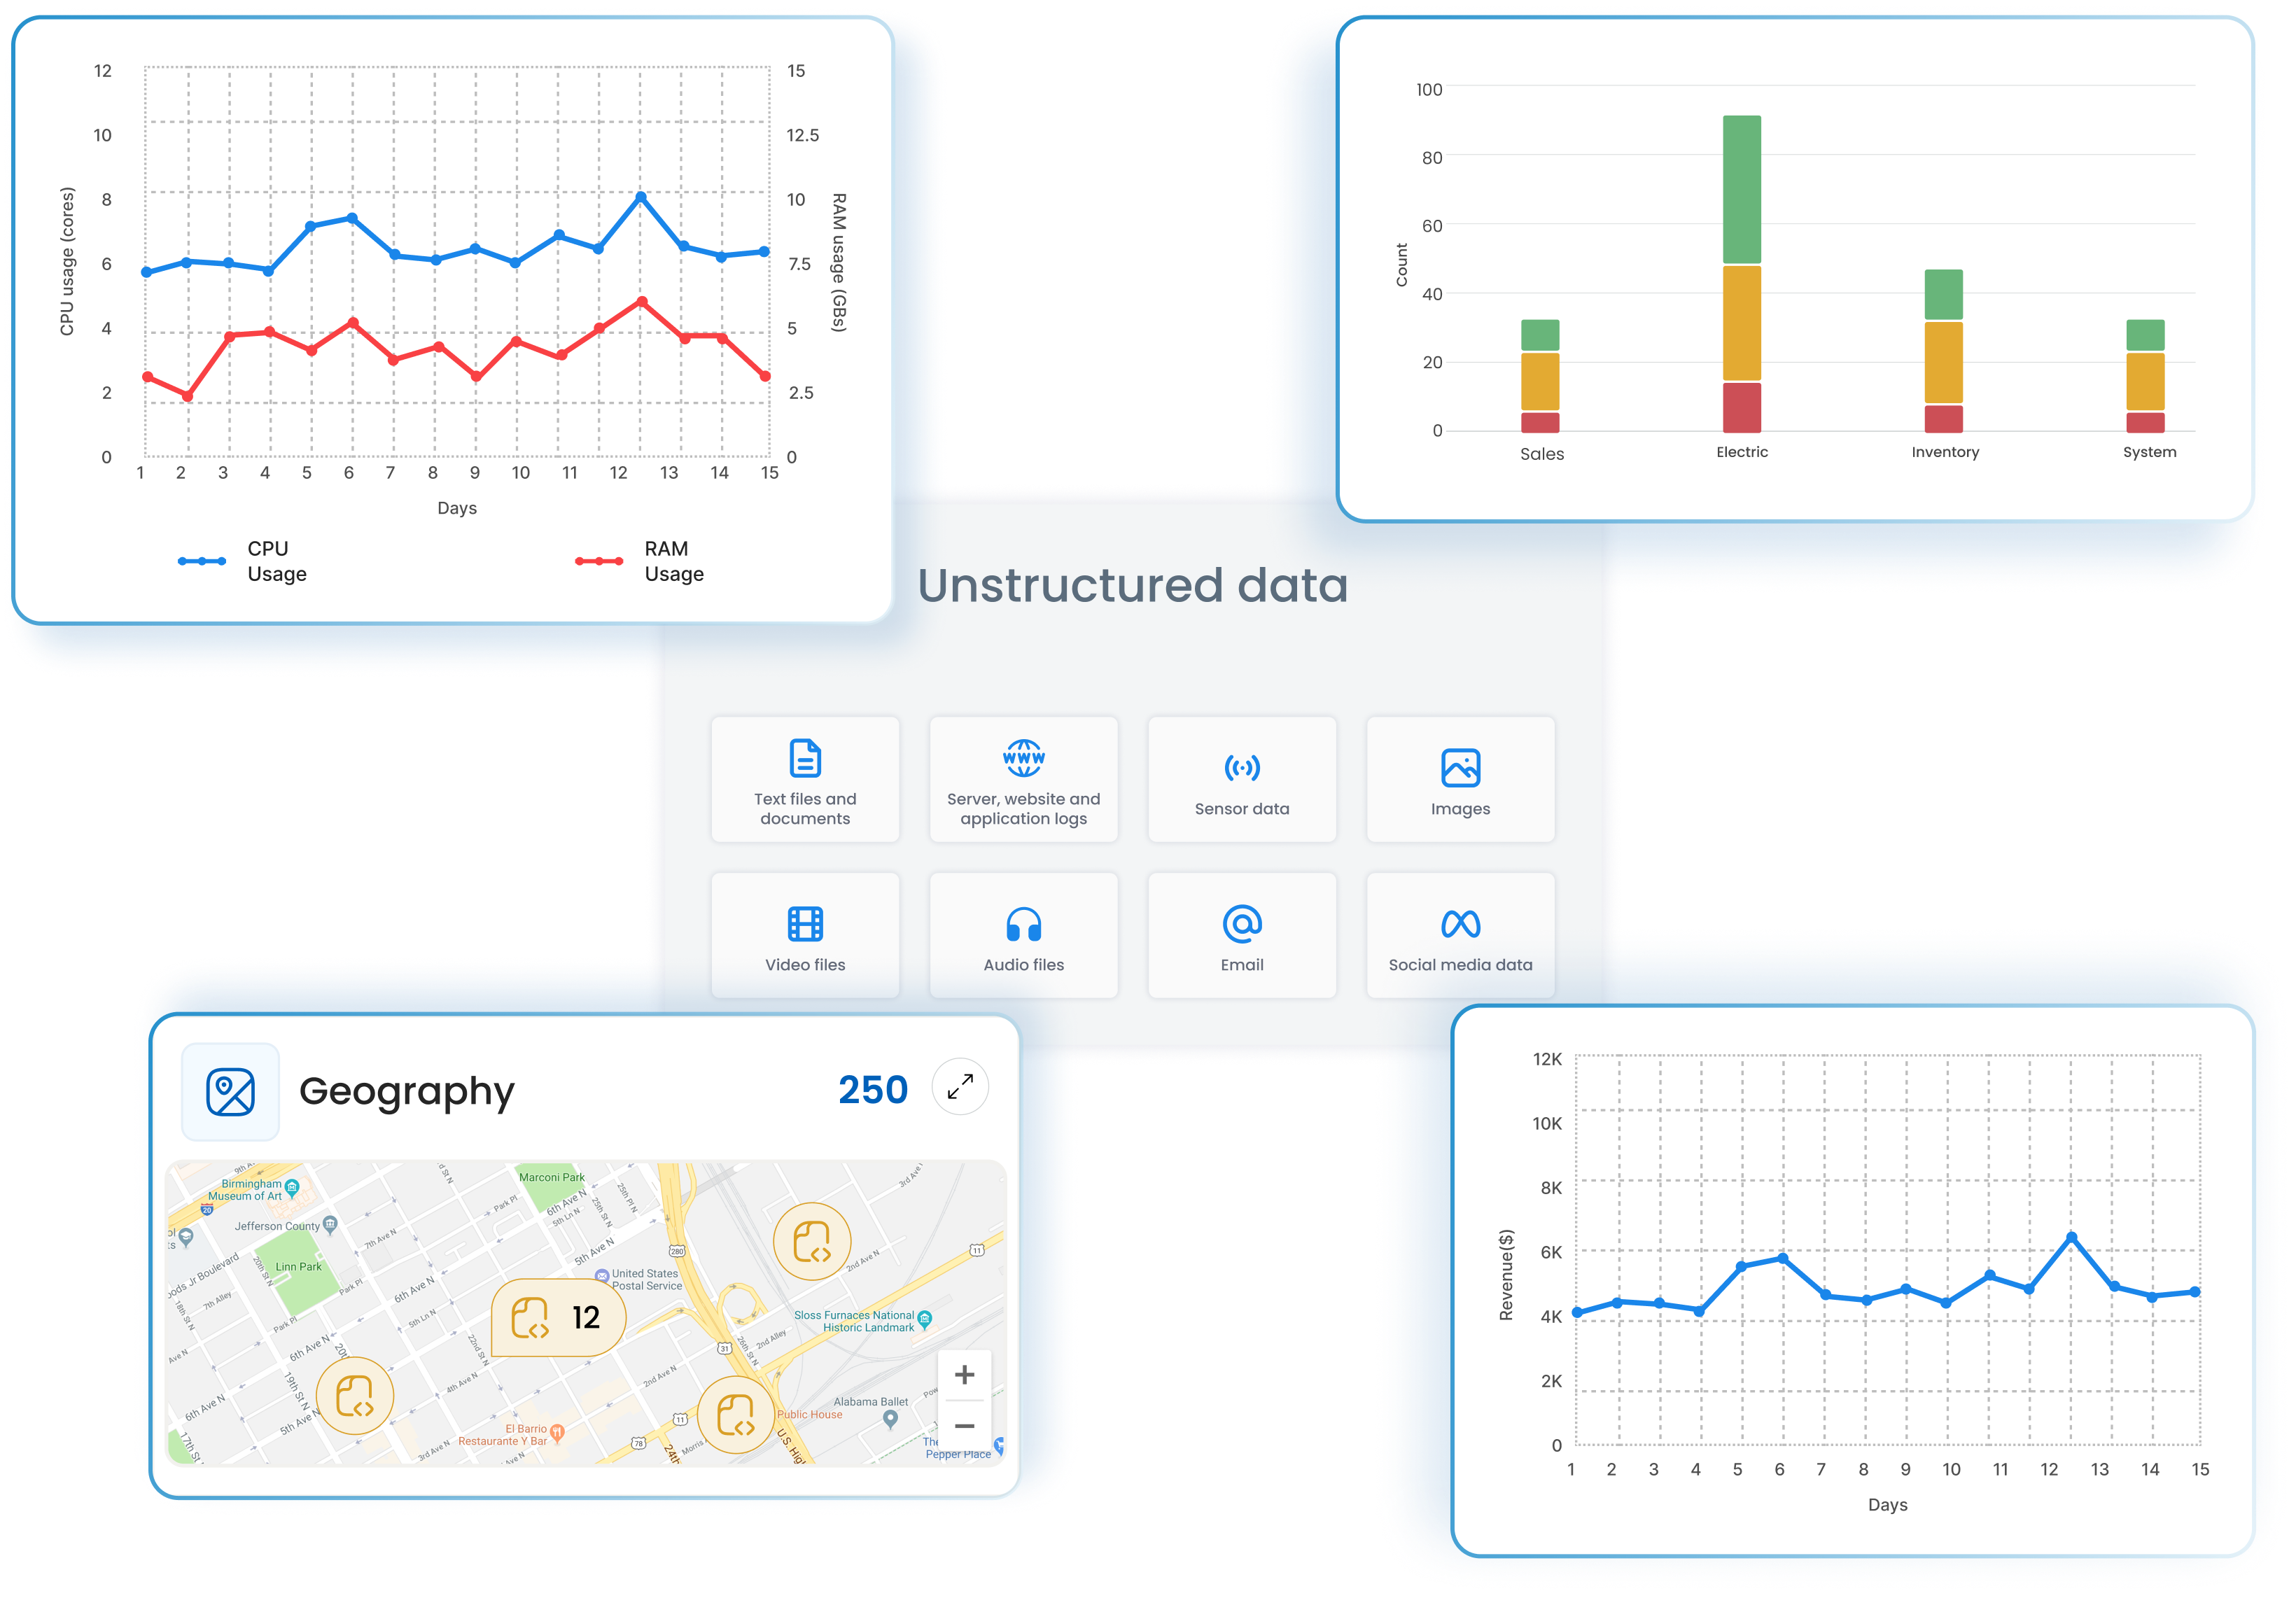
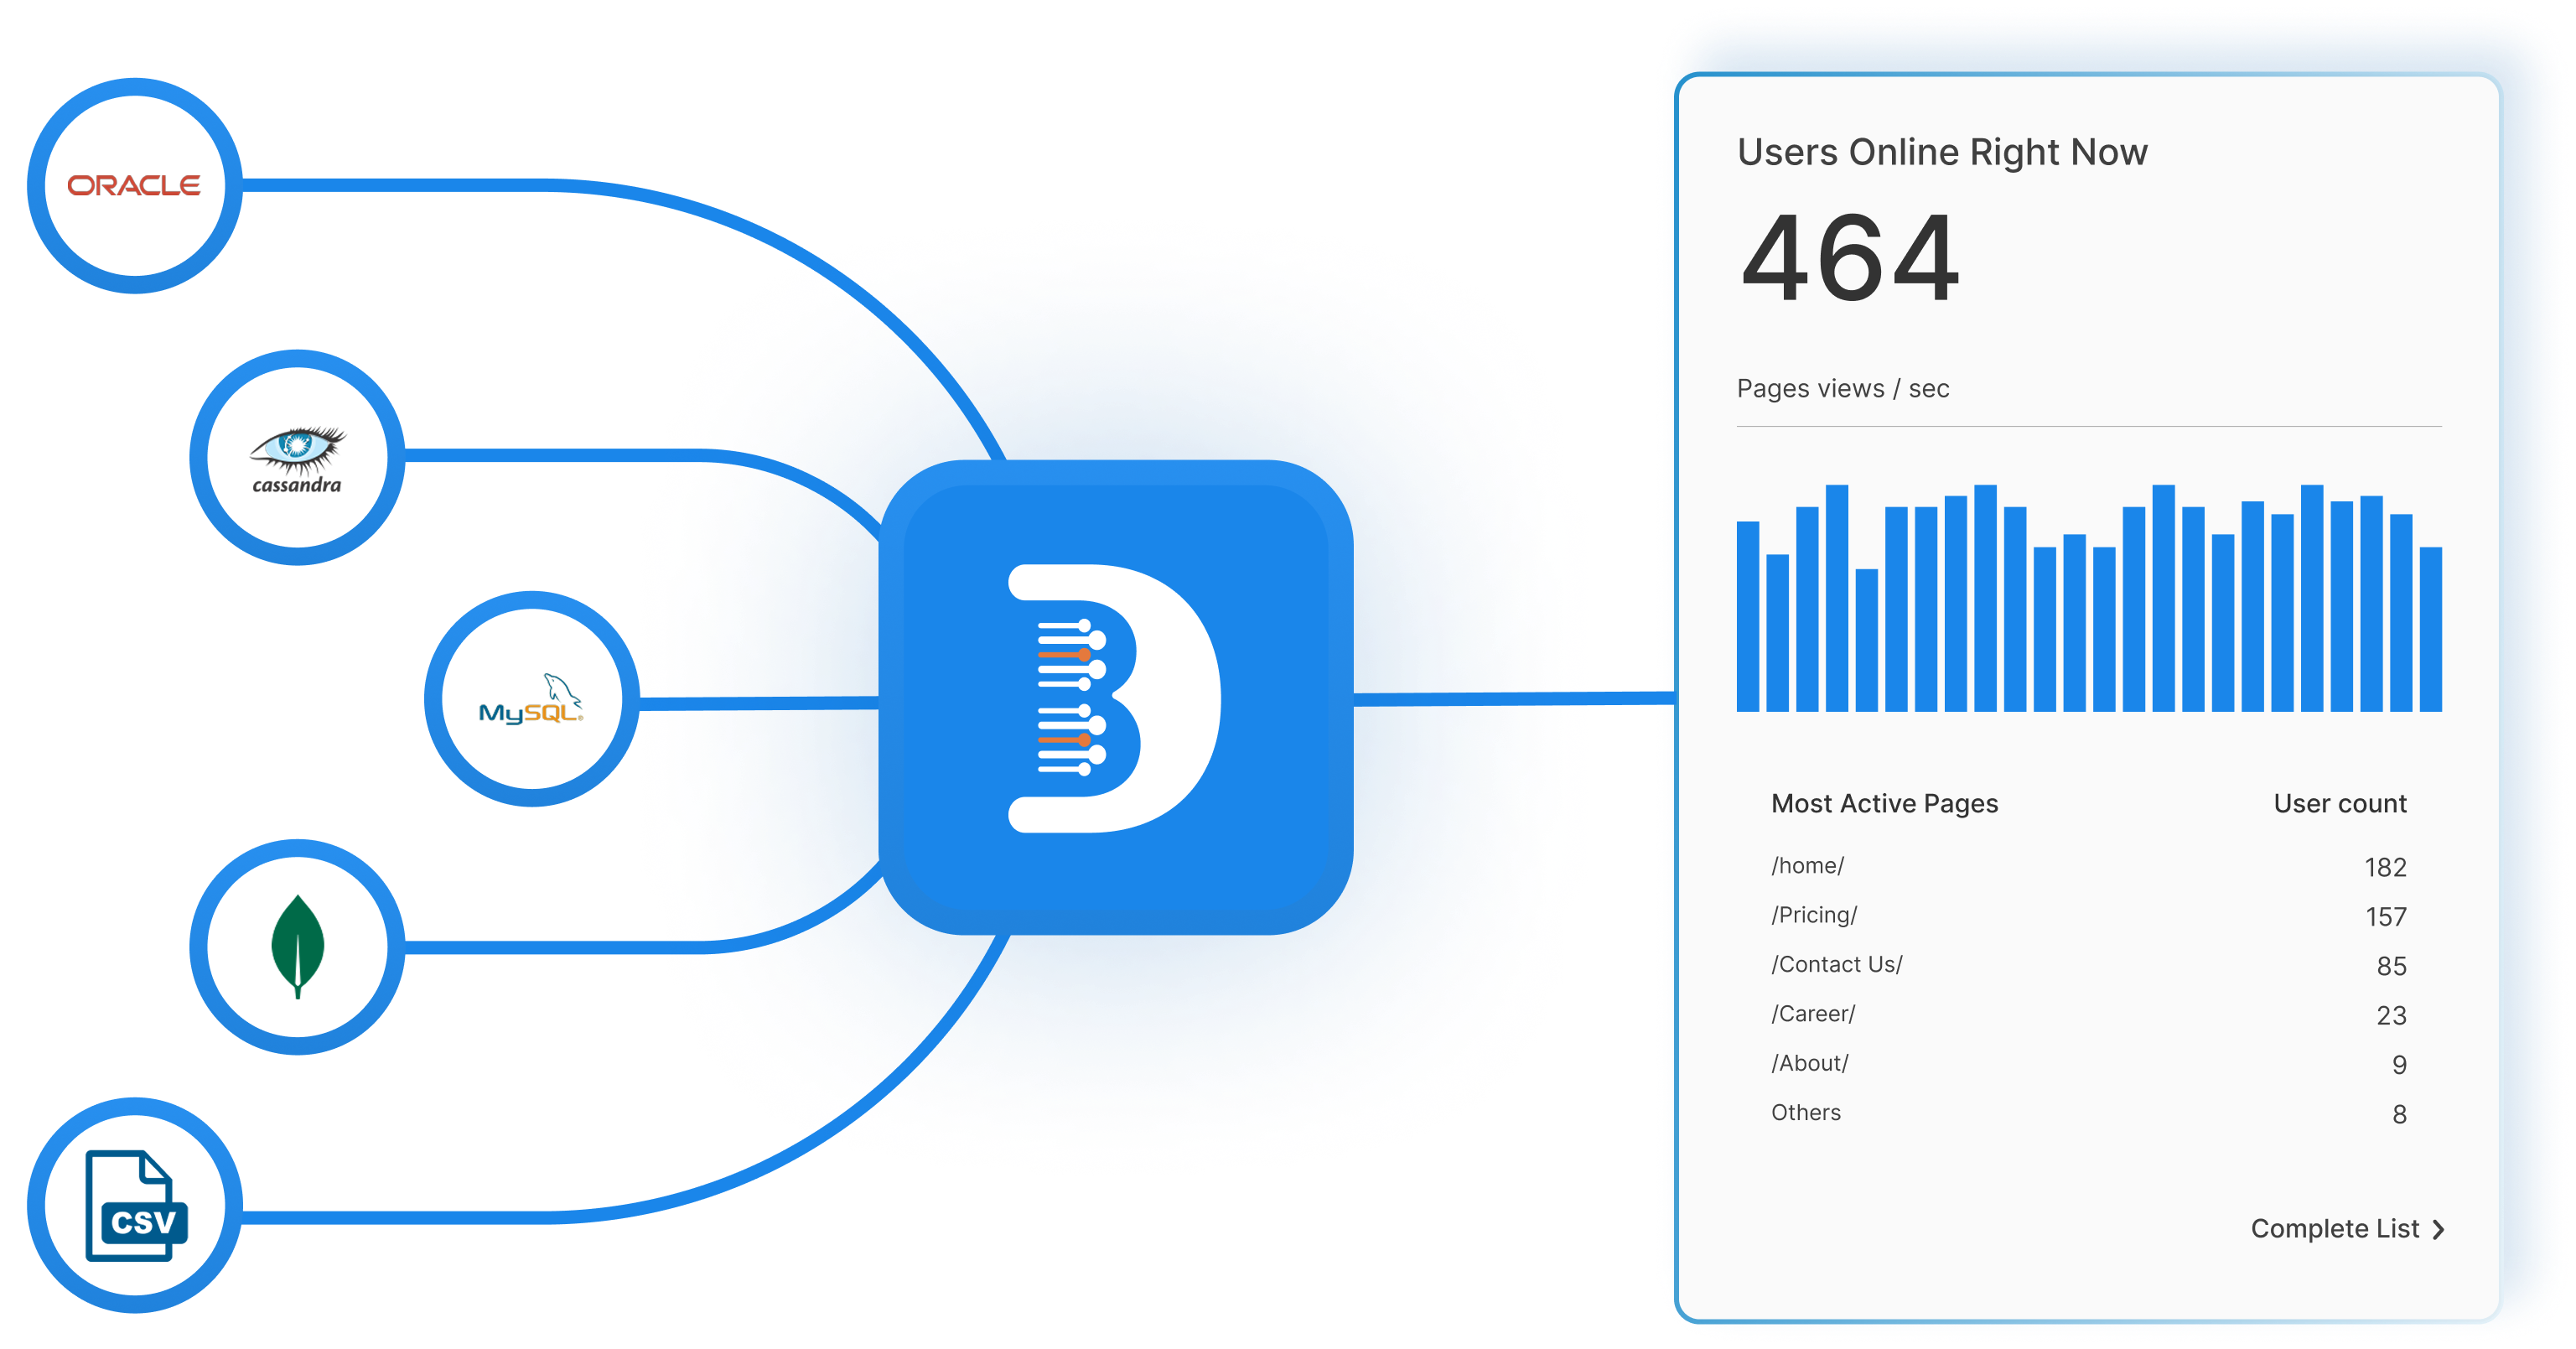
Harness insights from No-SQL databases & unlock unstructured data
DataByte BI goes beyond traditional boundaries to help businesses tap into the full potential of their data ecosystem.
With our cutting-edge technology, seamlessly connect, explore, and analyze data from No-SQL databases, enabling businesses to make data-informed decisions with confidence.
Our user-friendly interface and intuitive tools make it easy to explore and extract meaningful insights from No-SQL databases.
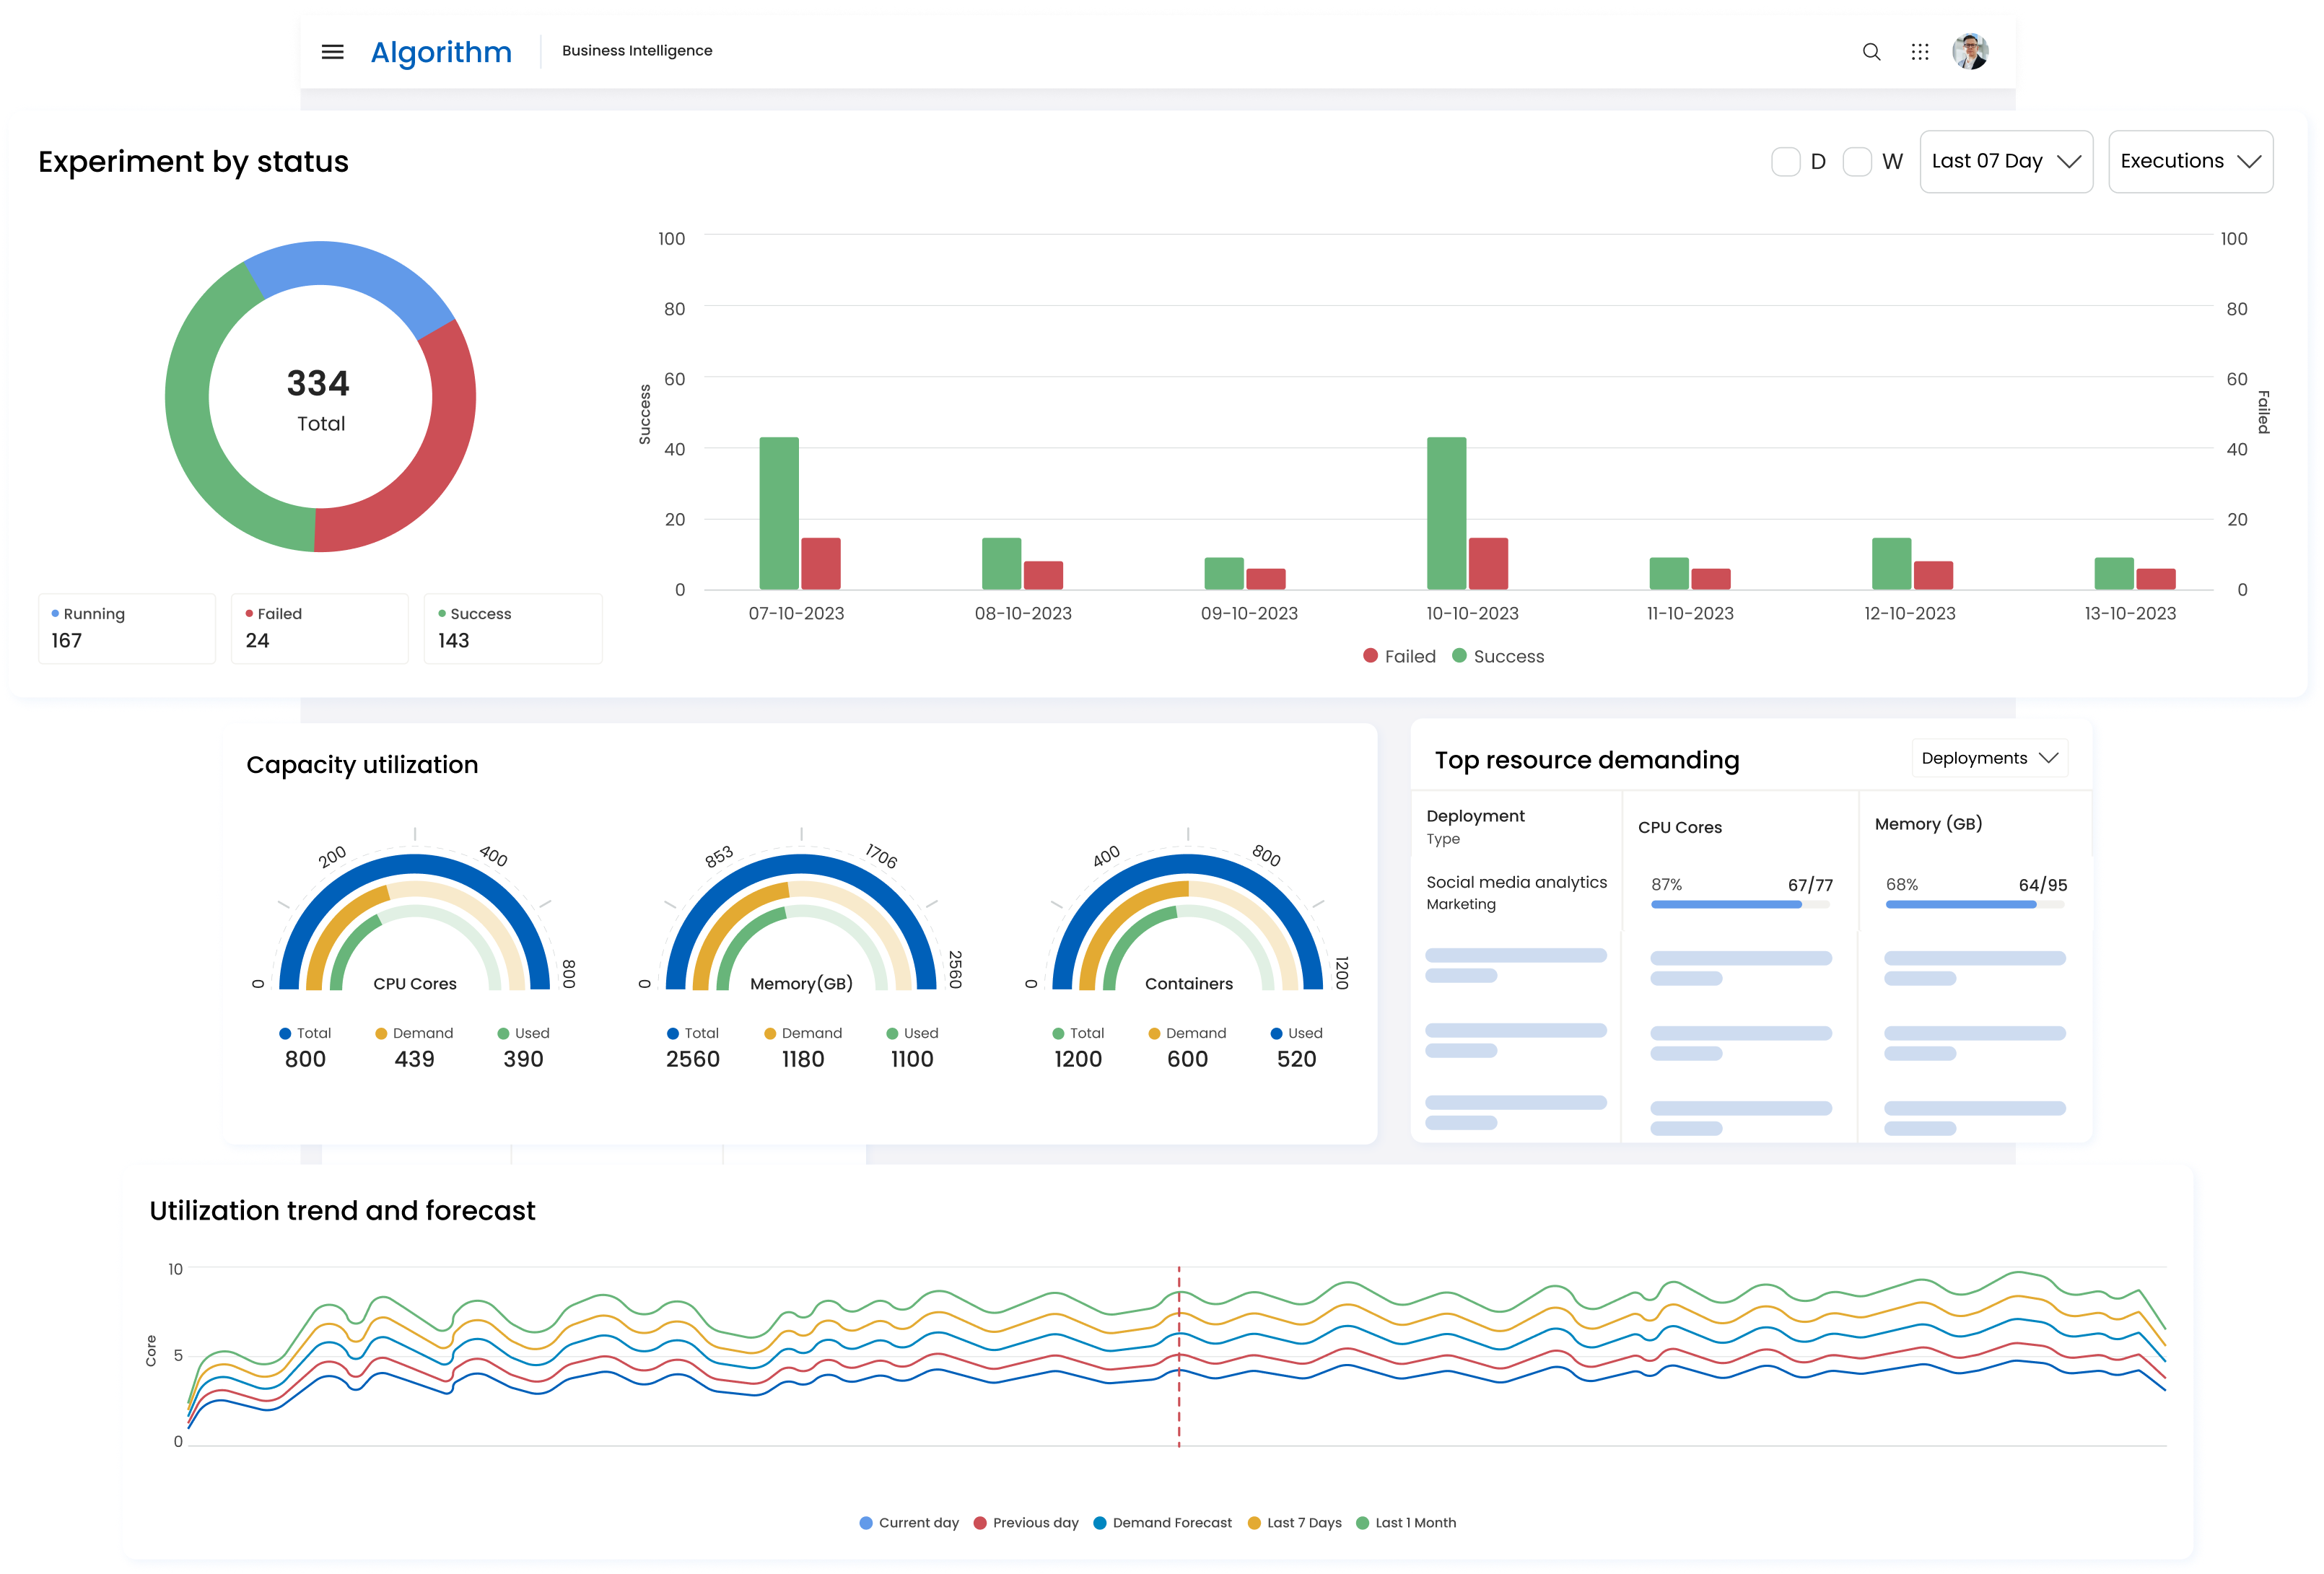
Spot trends as they appear with real-time business intelligence
DataByte's Real-Time BI continuously pulls in data from various sources, processes it, and updates the dashboards and reports in real-time.
With this powerful real-time BI capability, do not just look at historical data; access insights that are constantly evolving to keep pace with the business operations. Real-Time BI ensures that insights are always based on the latest data, eliminating the risk of outdated information.
Keep a close eye on critical metrics, KPIs, and performance indicators as they evolve in real-time, enabling businesses to spot trends and anomalies quickly.